WOPR - Thermonuclear war simulation
It all started with an experiment. I wanted to evaluate LibGDX with a simple although non-trivial application or game. Why not display a map of the world? Then add some airplane routes. Or they could be nuclear missile trajectories. Let’s add a retro text-based interface. Now I have something that looks like a 1980’s movie.
LibGDX
LibGDX is a cross-platform Java game development framework based on OpenGL (ES) that works on Windows, Linux, macOS, Android, the browser and iOS. It comes with a cookie cutter called LiftOff. Choose your language, your target platforms and the functionalities you want enabled and you get a ready-to-use Gradle project.
It supports Java primarily but you can write your program in Kotlin or even in Scala. Since most resources are written for Java, I picked this language but we are spoiled with choices. There may also be a performance hit with Kotlin and Scala, although it would probably not matter with my game. And one caveat: you won’t be able to target HTML5 unless you stick to Java.
Java version 21 turns out to be an okay choice anyway but I’ll be tempted to use Kotlin or Scala the next time. Although I wonder if functional programming plays well with a game on the JVM. If you favor immutable objects, these need to be created each frame (so at least 60 times per second) and discarded as quickly. The JVM and its garbage collector are extremely performant but I wouldn’t be surprised to see a performance hit in this particular use case, possibly forcing me to prefer mutable structures and losing some of the benefits of the functional paradigm. We’ll see.
The platform is well documented and you quickly get used to its idiosyncrasies, most of which come from OpenGL. It is straightforward and pleasant to use overall.
Hello World
Now how do you display a map of the world and missiles trajectories? Download any low resolution representation of the world in WGS84 format. You can rewrite the file by cutting some polygon edges to increase performances if needed. A country in a geojson file is typically a polygon.
"geometry": {
    "type": "Polygon",
    "coordinates": [
        [
            [
                6.116503906250017,
                50.120996093749994
            ],
            [
                6.108300781250023,
                50.09423828125
            ],
            (...)
            [
                6.089062500000011,
                50.154589843749996
            ],
            [
                6.110058593750011,
                50.123779296875
            ],
            [
                6.116503906250017,
                50.120996093749994
            ]
        ]
    ]
}
(...)
{
    "type": "Feature",
    "properties": {
        "featurecla": "Admin-0 country",
        "scalerank": 1,
        "labelrank": 2,
        "sovereignt": "Belgium",
        "sov_a3": "BEL",
        "filename": "BEL.geojson"
}
Each entry in the polygon represents a precise location on Earth. The Earth is an spheroid, but for our intent and purpose, we can certainly treat it a sphere and simplify the calculations. Because the Earth is a 3D volume, and that we are representing its curved surface on a flat surface (a screen), we must choose a projection. You cannot directly plot the raw coordinates. A well-known projection is the Mercator projection. The process of projecting inevitably introduces some distorsion. Mercator is conformal (every angle between two curves that cross each other is preserved) but it enlarges regions further from the equator.
To convert a WGS84 coordinate to a screen coordinate, assuming the Earth is --flat-- a sphere, we use the following formulas:
lon = (Lon[wgs84] + 180) / 360
lat = 0.5 - log(tan(PI / 4 + toRadians(Lat[wgs84]) / 2)) / (2 * PI)
We obtain lon and lat in the range [0, 1] with the equator at 0.5. LibGDX conveniently makes a distinction between the screen coordinates and the world coordinates. The latter can be set to be 0.0f-1.0f to match our formula. Convert every point of the polygon, draw the corresponding lines, and you have a country drawn on the screen.
I have also downloaded a .csv file containing cities with their location and number of inhabitants.
Hello missiles
Now it is time to add destructive nukes.
I wanted to have discrete trajectories for the missiles and avoid costly realtime calculations. So before the launch, the missile’s path is split in equidistant points. There are more points on the path if the travel distance is longer but the distance between two points on one trajectory is close to the one on another trajectory.
A..........B
A..................C
The distance between 2 points A and B is given by the haversine formula:
A = (λ1, φ1), B = (λ2, φ2)
Δφ = φ2 - φ1, Δλ = λ2 - λ1
a = sin(Δφ / 2) . sin(Δφ / 2) +
    cos(φ1) . cos(φ2) . sin(Δλ / 2) . sin(Δλ / 2)
2 * atan2(√a, √(1 - a))
where atan2 returns the angle θ from the conversion of rectangular coordinates (x, y) to polar coordinates (r, θ).
From here, we animate the missiles in the game loop.
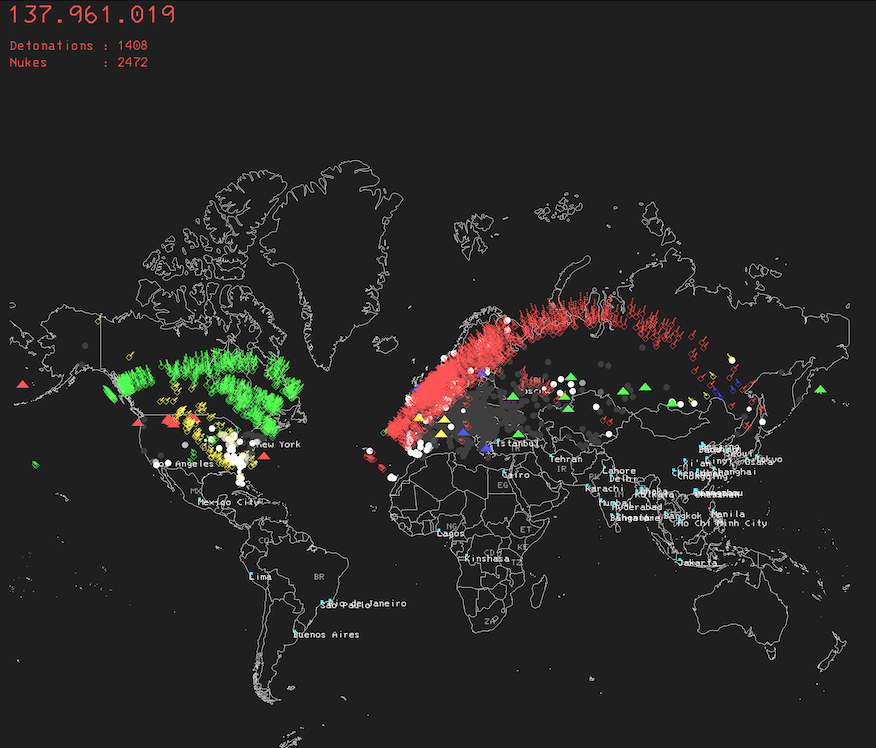
Scenarios of destruction
Nowadays, USA and Russia possess the largest nuclear arsenals (5.044/1.770 and 5.580/1.710 total/deployed warheads respectively). France and UK have a more modest 290/280 and 225/120. They would still inflict grave damages though. China has a weird ratio of 500/29. Unsurprisingly it still enough to destroy a neighbor country like Russia.
The simulation is very crude and focuses on direct casualties using bombs of equal yields (300kT). The effect on a city depends on the number of inhabitants without taking into account its density (there would be more casualities in New York vs Los Angeles). I ran a few tests on this site to get something realistic.
Reality would be much more complex, with several launch phases, targetting both cities and infrastructures (e.g. power plants, airports), with differences between ground and air bursts, the effects of the fallout, missile interception capabilities, etc. But the 1980’s inspiration movie did not do much more than that.
Half a dozen scenarios inspired from the current world order madness are stored in a JSON file.
Run any of them and watch the world burn. Keep in mind: there is no winner in this game.
Repository — licensed under the EUPL 1.2.